
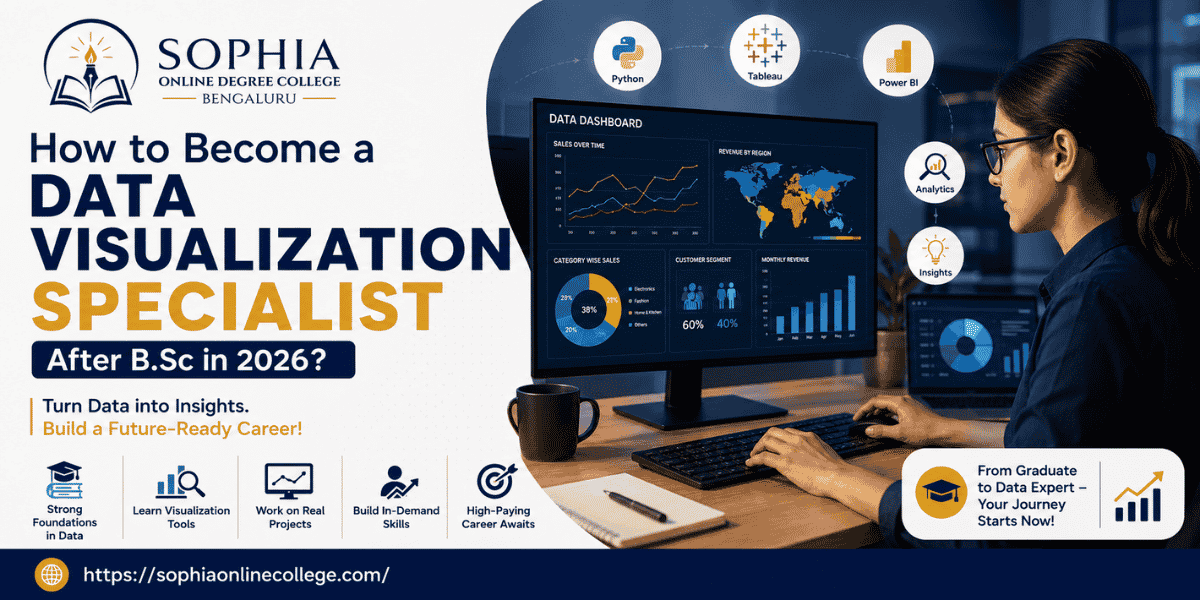
A B.Sc degree provides a wide range of analytical and tech-related career opportunities. However, many graduates are often at a loss concerning the next step to make towards the profession. If you enjoy working with data, detecting patterns, producing graphics, and communicating effectively, becoming a Data Visualization specialist might be a fulfilling career choice in 2026.
This profession involves creating charts, dashboards, reports, visualizations, and narratives about the data. Therefore, the job requires a blend of analytical and technological expertise, as well as communicative and artistic skills. B.Sc graduates have a solid advantage over other career paths since their studies provide a substantial foundation of analytics, research, or scientific background.
Fortunately, one does not have to be completely illiterate in the field to pursue the profession. With the right knowledge, tools, and practical experience, anyone is capable of becoming a Visualization Specialist.
What Does a Data Visualization Specialist Actually Do?
Before diving into this career path, it is essential to get to know the job description.
A Data Visualization Specialist deals with presenting information that was previously difficult to understand and analyse.
The information is transformed using graphics that allow it to be easily grasped at a glance.
For instance, a company can generate hundreds of Excel sheets regarding sales.
From the data, it might not be easy to tell what is selling, what is not selling, where sales are located in each region, and the months with the lowest sales.
A Data visualization specialist would be able to display this information in a graphical dashboard indicating sales statistics, customer insights, and essential metrics.
They would also create visualisations that identify the most popular items, those that are not selling, and the months with the highest sales.
A data visualization specialist’s responsibilities include understanding the business requirements, preparing data sets, discovering meaningful data, determining the visualization techniques that best fit the task at hand, producing dashboards and reports, and conveying the story behind the data to facilitate informed business decisions.
In short, they make hard-to-read data more accessible to understand and promote better decision-making.
Why Can B.Sc Graduates Choose This Career?
One of the most significant benefits of having a degree as a B.Sc graduate is the analytical skills foundation.
Depending on the specialization, it can include strong mathematical and statistical reasoning, knowledge of scientific data, research and experimentation, logic, computer programming, or any other field.
For example,
the B.SC Mathematics program will provide analytical and quantitative skills, B.Sc Statistics will help understand statistical and analytical models better, B.Sc Computer Science will assist in learning the concepts behind databases and analytical software development, B.Sc Data Science studies will give a thorough understanding of analytics, and other sciences will help develop visualization skills if studied with the right practical approach.
Therefore, the Data Visualization Specialist career path is not tied to a specific specialization but can be chosen by any B.Sc graduate.
Moreover, if you are interested in receiving a science education through distance learning in Bangalore, you might also find some valuable options for getting an additional education while being able to pursue other career development opportunities.
The Skills You Need to Become a Data Visualization Specialist
The skills you must acquire to become a Data Visualization Specialist are as follows:
1. Data Interpretation
The first step is learning to interpret the data. As a future Data Visualization Specialist, you should be able to derive insights such as trends, patterns, outliers, comparisons, relationships, changes, or variations in the dataset.
2. Excel
Excel is good for getting started with data visualization as it helps one learn spreadsheet features, formulas, and functions, and create pivot tables, reports, and charts. It also serves as a stepping stone to higher-level business intelligence reporting tools.
3. SQL
SQL aids in extracting, analyzing, and transforming data from databases. Some of the concepts one should master include SELECT, WHERE, GROUP BY, JOIN, aggregation, subqueries, and Window functions. Most BI and visualization tools require knowledge of SQL to load data into it.
4. Power BI
Power BI is among the best data visualization tools, especially when it comes to business dashboards and reporting. With Power BI, one can generate reports, dashboards, and visualizations such as filters, KPIs, and storyboards.
5. Tableau
Like Power BI, Tableau is also a visualization tool used in creating visual dashboards and stories. However, one can start by mastering either Power BI or Tableau and later acquire knowledge in the other one.
6. Data Storytelling
The last skill is data storytelling. It is essential to know how to present the visualizations, derive insights from the data, and respond to questions that may arise concerning the information. A good data storytelling skill should be able to present what happened and explain what the data means, why it happened, and its significance and what should be done in the future.
Power BI vs Tableau: Which One Should You Learn First?
Both tools are valuable, so the right choice depends on your career goal.
| Tool | Best For | Beginner Focus |
| Power BI | Business dashboards and reporting | High |
| Tableau | Interactive visual storytelling | High |
| Excel | Basic analysis and reporting | Very High |
| Python | Advanced and customised visualization | Medium |
| SQL | Data extraction and preparation | High |
For many Indian beginners, Power BI proves to be a more accessible choice for their first position in the field, whether they are considering BI/reporting roles or a more analytics-heavy position, but Tableau retains an edge if one wants to specialize in visualizations, for instance. The same considerations were expressed in the 2026 conversations about the best tools to choose for one’s career, depending on the intended field and company.
However, one should not get fixated on the choice of the tool, as a competent Data Visualization Specialist would first understand how the data works to be able to represent it correctly.
How to Start Your Learning Journey After B.Sc?
A lot of people make the mistake of trying to learn.
SQL, python, power bi, tableau, statistics, cloud computing, and machine learning all at once.
The thing is, when you start you should go slow, step by step. Here’s a learning path I suggest:
Bsc, excel, statistics, sql, power bi/tableau, data storytelling, projects, portfolio, job hunting.
The idea is, once you know excel pretty well, move onto statistics, then to SQL, and then to one of the 2 visualization tools, and then making dashboards, and then eventually you can start doing projects and make a portfolio to get jobs. Once you are comfortable in making dashboards, you can then learn dax, power query, or even python visualization libraries or data modelling or tableau calculations, whatever is harder for you.
Build Projects Before You Start Applying
A certificate is proof that you have completed a training program. A project is proof that you can apply the skills learned in practice.
It is vital for fresh graduates.
A Data Visualization Specialist portfolio includes such projects as:
Project 1: Sales Dashboard
Analyse:
- Monthly sales
- Best-selling product
- Regional sales
- Profit margins
- Top products
Project 2: Student Performance Dashboard
Analyse:
- Students scores
- Attendance
- Each subjects performance
- Pass percentages
- Performance trends
Project 3: Customer Analysis Dashboard
Explore:
- Customer groups
- Their purchasing patterns
- How much they contribute to the revenue
- Customer retention
- Product preferences
Besides creating a visualization, for each project, explain what problem you were solving, what data you used, your analysis, what charts you chose, your conclusions, and what recommendations you made. It is vital to demonstrate your understanding of the data visualization process rather than simply showing that you know how to make charts.
How to Build a Portfolio Without Work Experience?
Perhaps, you wonder how to gain experience if everywhere they ask for experience. In this case, a portfolio can help you to partially solve this issue.
Put together a few nice projects (3-5) and describe them. Mention project objective information on the dataset(s), including the size and the source, software and tools used, data preparation steps, present dashboards, significant insights, and recommendations.
You can store them on GitHub, Tableau Public, Power BI community, or a personal website. The bottom line is that you can demonstrate your skills when someone asks for it.
What Kind of Jobs Can You Get?
Your first job may not always carry the exact title Data Visualization Specialist.
Companies use different titles for similar or overlapping responsibilities.
| Job Role | Typical Work |
| Data Analyst | Analyse data and communicate insights |
| BI Analyst | Build reports and business dashboards |
| Reporting Analyst | Prepare recurring reports and KPIs |
| Power BI Analyst | Develop Power BI reports and dashboards |
| Tableau Analyst | Create Tableau visualizations and reports |
| Data Visualization Specialist | Turn complex data into visual stories |
| Business Analyst | Connect data insights with business requirements |
Power BI-related career resources highlight Data Analyst, Business Analyst, and Data Visualization Specialist as professions which include opportunities to apply visualization skills.
This signifies that one should not be limited by the idea of a visualization career. A person may acquire experience and advance to higher-level fields such as business intelligence, analytics, consulting, and storytelling.
Can You Study Further While Building These Skills?
Yes, Some students may be interested in continuing their studies while gaining hands-on experience in analytics.
A student studying at a B.Sc correspondence college in Karnataka may need to consider several options if they are interested in further studies in Analytics.
The same goes for a student looking to pursue a distance Msc degree college in Bangalore.
If you are considering a Correspondence college in India, make sure you choose the right one.
Don’t just pick based on ease of admission.
Think about the university, course structure, curriculum, examination pattern, and support system before short-listing your options.
Sophia Online College can also assist you and advise you on the best distance, correspondence, and online courses depending on your field of study.
What About IT and Other Distance Education Options?
While some B.Sc graduates may consider pursuing higher education in technology and analytics,
when comparing IT distance programs, ensure to look beyond the name and focus on the syllabus. Does it cover programming, databases, analytics or other emerging specializations?
Similarly, while there are many distance education options in Bangalore, you need to know your goal, eligibility, budget, flexibility needs, and preferred specialism before selecting one institute and course.
The qualification will equip you with theoretical knowledge, while practical skills are needed to become a competent Data Visualization Specialist Hire.
How Long Does It Take to Become Job-Ready?
There is no magic number as you have to consider where you are now.
If, for example, you know Excel and statistics well, it can take significantly less time than someone who has to start from scratch.
A possible breakdown of the learning process would be something like:
Month 1: Excel + data fundamentals
Month 2: SQL basics
Month 3: Power BI or Tableau
Month 4: Advanced dashboards + data storytelling
Month 5: Portfolio projects
Month 6: Resume + interview preparation + job searching
The point is not to learn tools as quickly as possible but to develop skills to solve real-world problems.
What Should You Know For Your First Interview?
Interviewers may ask both technical and analytical questions.
You may be asked:
- How would you approach charting this dataset?
- What’s the difference between a measure and a dimension?
- How would you address missing data?
- What is JOIN in SQL?
- How would you improve this dashboard?
- How can we make this dashboard more intuitive?
- How would you explain this drop in sales?
- How do you prioritize KPIs on a dashboard?
A good candidate for a Data Visualization position knows how to justify their answers.
For example, if sales are up, but profits are down, you cannot conclude that everything is fine and nothing should be changed. You may need to explore why it happened – check if discounts were increased, product mix changed, operating expenses grew, profits in certain regions dropped, etc.
Common Mistakes to Avoid
Many people make the same mistakes while entering the data field.
Learning Too Many Tools
You do not need ten tools to get a job. It is essential to learn the basics first.
Collecting Certificates Without Projects
While certificates are important, it is necessary to collect practical experience to have something relevant to say during an interview.
Making Dashboards Look Pretty but Say Nothing
A dashboard with bright colours and appealing graphics is not always useful. Every graphic should respond to a particular question.
Ignoring SQL
It is vital to understand how data is stored and retrieved. This will make you much more valuable than someone who knows only visualization tools.
Forgetting the Audience
A dashboard for a CEO cannot be the same as a dashboard for an analyst. It is essential to remember who will use your product.
Copying Projects
It is not wrong to follow tutorials, but try to make your projects unique. Many recruiters can tell fake projects from real ones.
Is Data Visualization a Good Career After B.Sc in 2026?
For someone who wants to learn data visualization and make a career out of it, this can be a good choice.
The job requires a combination of analytical, data handling and visualization skills along with effective communication and business knowledge.
Moreover, the domain offers variety – not just one job profile. Visualization skills are needed in data analytics, business intelligence, reporting, etc. The same career guide also mentions higher-level profiles like senior business intelligence professionals and analytics leaders that one can grow into, starting from a visualization expert.
However, while learning Power BI or Tableau can get you started, it is important to understand the importance of data interpretation and storytelling with data, and being able to demonstrate one’s competence in it.
Conclusion
Becoming a Data Visualization Specialist after B.Sc. is not a matter of accumulating as many certificates as possible but instead, building a certain set of competencies.
First, expand your knowledge and skills from the B.Sc. course. Improve the basics like Excel or SQL, learn to work with specific DSS tools such as Power BI or Tableau, develop relevant projects, and build a portfolio. Finally, start looking for jobs that allow you to continue learning.
On the other hand, if you are considering taking Science distance education in Bangalore or B.Sc correspondence college in Karnataka or any other alternative educational program, you should make the choice based on your broader career prospect rather than current convenience.
Sophia Online College can assist you in pursuing a flexible learning pathway if you are considering making this type of educational choice and need guidance.
Ready to Take the Next Step?
If you dream of leaving your B.Sc study behind and building a successful career utilizing data, technology, visualization, and business, now is the perfect time to start preparing.
Explore your options, discover the right learning path for you, build your portfolio and make that first step into the fascinating career of a Data Visualization Specialist by 2026.
Connect with Sophia Online College now and learn more about your education options and what to do next, considering your academic background and career aspirations.
FAQs
1. Can I become a Data Visualization Specialist after B.Sc?
Yes, a learner can build a career as a Data Visualization Specialist after B.Sc with skill development and practical application of skills. They do have a solid foundation for Data Visualization as the B.Sc course might have improved their logical, analytical, mathematical, statistical, or reasoning skills. An individual must learn Excel, SQL, Power BI, Tableau, statistics, and data storytelling to become a Data Visualization Specialist. Moreover, they should also gain practical experience since companies will judge their skill implementation. If one is looking for Science distance education in Bangalore, they should choose the best option that helps them learn extra skills to become a Data Visualization Specialist.
2. Is coding necessary for a Data Visualization Specialist?
An individual might not need advanced coding skills to become a Data Visualization Specialist. Mostly, Excel, SQL, Power BI, Tableau, data interpretation, and dashboard development are sufficient for entry-level positions. Nonetheless, coding is vital for implementing advanced Data Visualizations and working on challenging projects. Therefore, learners can also consider developing additional coding skills like Python which is helpful in data cleaning, statistical analysis, and building advanced visualizations. Similarly, most Data Visualization Specialists work with SQL for managing and analyzing databases. For someone considering IT distance education, they should choose the best distance learning institution that offers coding and database knowledge beneficial for their chosen career.
3. Which is better for beginners, Power BI or Tableau?
Both Power BI and Tableau are appropriate for Data Visualization beginners. However, Power BI is better for dashboard creation, storytelling, and business report generation while Tableau is superior in advanced visualization and exploration. Instead of trying to learn both BI tools together, it is practical to start with one and then proceed to the other. A learner should be able to create dashboards using either Power BI or Tableau before considering advanced Data Visualization techniques. In case of a B.Sc correspondence college in Karnataka, one should consider which program allows them to balance their career and academic needs.
4. Do I need an M.Sc to become a Data Visualization Specialist?
An M.Sc is not mandatory to become a Data Visualization Specialist. Mostly, employers value practical skills more than the degrees one possesses. Nonetheless, a candidate might need an M.Sc if they plan to pursue advanced statistics, analytics, or a related field. For those considering a distance Msc degree college in Bangalore, they should compare the programs’ eligibility requirements, syllabi, accreditation, study modes, and relevance before choosing the best option. One should always remember that their practical skills and presentation matter more than the degrees when pursuing careers in Data Visualization and related fields.
5. What projects should a fresher create?
A fresher should make relevant and impressive projects to secure a Data Visualization job. For instance, one can make a Dashboard for Sales Analysis, Student Performance Dashboard, Customer Dashboard, Financial Performance Dashboard, Healthcare Dashboard, and Marketing Dashboard, among others. It is vital to highlight what the project entails, the problem it solves, the dataset used, the tools applied, key findings, and recommendations. One should always avoid making dashboard projects only since the hiring managers will want to see if they can handle diverse projects upon recruitment. In case of a Correspondence college in India, one should ensure they can balance their studies and skill development.
6. Is data visualization suitable for non-IT B.Sc graduates?
Data visualization is an excellent career option for non-IT B.Sc students who enjoy working with data, research, numbers, statistics, and related concepts. Students who studied math, statistics, science, physics, chemistry, and other disciplines can easily become Data Visualization Specialists with the appropriate skills. They do not have to be experts in coding but should start by mastering Excel, statistics, and SQL before learning a Dashboard tool like Power BI or Tableau. When searching for distance education in Bangalore, such students should consider enrolling in an institution that offers flexible learning options while giving them enough time to develop practical skills alongside theoretical aspects.
7. Can data visualization lead to a Data Analyst career?
Yes, anyone interested in Data Visualization can become a Data Analyst since both careers have overlapping skills. These include working with data, interpretation, visualization, and providing insights to help organizations make better business decisions. Therefore, a Data Analyst career requires knowledge of Dashboard tools like Power BI and Tableau. Additionally, learners must gain coding skills, such as SQL and Python knowledge, and highlight these skills when looking for job opportunities. For students considering Science distance education in Bangalore, they can use the acquired knowledge in statistics and computer science to become Data Analysts and Data Visualization Specialists.
8. What should I learn after Power BI?
A learner should consider various career options when deciding what to learn after Power BI. For instance, they can acquire SQL skills and master Power Query, DAX, and Power BI Data Modeling for more profound knowledge. Alternatively, they can learn Python, Tableau, and SQL to become a Data Scientist. Additionally, they should invest time and effort in comprehending data storytelling since it is vital to analyze data and tell compelling stories about it in the quest for better business decisions. For learners considering Science distance education in Bangalore, they should add relevant practical skills to their academic qualifications to become successful Data Visualization Specialists. In the long run, the additional practical skills will enable them to pursue careers in Data Analytics, Business Intelligence, and related fields.